I had an integration test that was very complex (most are, sadly) and took too long to start. I was able to diagnose why using new features of Go’s 1.10 trace tool. This post describes my workflow and what led me there.
The example code I’m using for this post is at https://github.com/cep21/trace-110. My integration test was a bit more complex, but generally had startup that was slow due to a single goroutine out of many that did lots of different things. In this example, takeIO is similar to the “startup” part of my integration test.
package trace_110

import (
    "testing"
    "sync"
    "fmt"
    "time"
    "net/http"
)

func takeCPU(start time.Time, wg *sync.WaitGroup) {
    defer wg.Done()
    j := 3
    for time.Since(start) < time.Second {
        for i :=1; i < 1000000; i++ {
            j *= i
        }
    }
    fmt.Println(j)
}

func takeTimeOnly(wg *sync.WaitGroup) {
    defer wg.Done()
    time.Sleep(time.Second * 3)
}

func takeIO(start time.Time, wg *sync.WaitGroup) {
    defer wg.Done()
    errCount := 0
    for time.Since(start) < time.Second * 4{
        _, err := http.Get("https://www.google.com")
        if err != nil {
            errCount++
        }
    }
    fmt.Println(errCount)
}

func startServer() {
    wg := sync.WaitGroup{}
    wg.Add(3)
    start := time.Now()
    go takeCPU(start, &wg)
    go takeTimeOnly(&wg)
    go takeIO(start, &wg)
    wg.Wait()
}

func TestServer(t *testing.T) {
    startServer()
}
Generate a CPU profile Link to heading
My first thought was to generate a CPU profile.
go test -cpuprofile cpu.prof
Unfortunately, this shows CPU usage when my integration test was hanging somewhere due to network usage.
(pprof) top1
Showing nodes accounting for 810ms, 82.65% of 980ms total
Showing top 1 nodes out of 81
 flat flat% sum% cum cum%
 810ms 82.65% 82.65% 820ms 83.67% github.com/cep21/trace-110.takeCPU
(pprof) top1 -cum
Showing nodes accounting for 810ms, 82.65% of 980ms total
Showing top 1 nodes out of 81
 flat flat% sum% cum cum%
 810ms 82.65% 82.65% 820ms 83.67% github.com/cep21/trace-110.takeCPU
View the CPU profile in a web UI (new in 1.10) Link to heading
I tried looking at the profile in a web UI to see if that would help: it didn’t
go1.10beta1 tool pprof -http=localhost:12345 cpu.prof
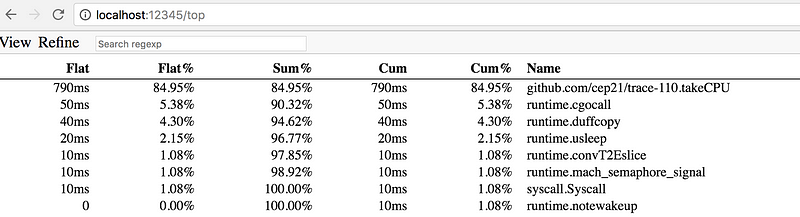
Nope, still showing cpu usage
Generate a blocking profile (improved in 1.10) Link to heading
I thought maybe it was blocking stuff, so I generated a blocking profile
go test —blockprofile=block.out
When I tried to use it, nothing showed up. Very unhelpful :(
< go tool pprof block.out
Main binary filename not available.
Type: delay
Entering interactive mode (type “help” for commands, “o” for options)
(pprof) top
Showing nodes accounting for 12.65s, 100% of 12.65s total
 flat flat% sum% cum cum%
 12.65s 100% 100% 12.65s 100% <unknown>
The old solution was to compile the test binary first, but with go 1.10 I don’t need to do this!
< go1.10beta1 test -blockprofile=block.out
.....
< go1.10beta1 tool pprof block.out
(pprof) top
Showing nodes accounting for 12.34s, 100% of 12.34s total
Dropped 31 nodes (cum <= 0.06s)
Showing top 10 nodes out of 32
flat flat% sum% cum cum%
4.21s 34.09% 34.09% 4.21s 34.09% runtime.chanrecv1
4.13s 33.46% 67.55% 4.13s 33.46% runtime.selectgo
4.01s 32.45% 100% 4.01s 32.45% sync.(*WaitGroup).Wait
0 0% 100% 4.01s 32.45% github.com/cep21/trace-110.TestServer
0 0% 100% 4.01s 32.45% github.com/cep21/trace-110.startServer
0 0% 100% 4s 32.40% github.com/cep21/trace-110.takeIO
Closer, but still a bit too noisy for my real code.
Generate a trace Link to heading
Go’s trace tool is what I need here. It has the level of detail I need, limiting my profiles to specific goroutines.
go test -trace trace.out
Now let’s view the trace output.
go1.10beta1 tool trace trace.out
The initial UI
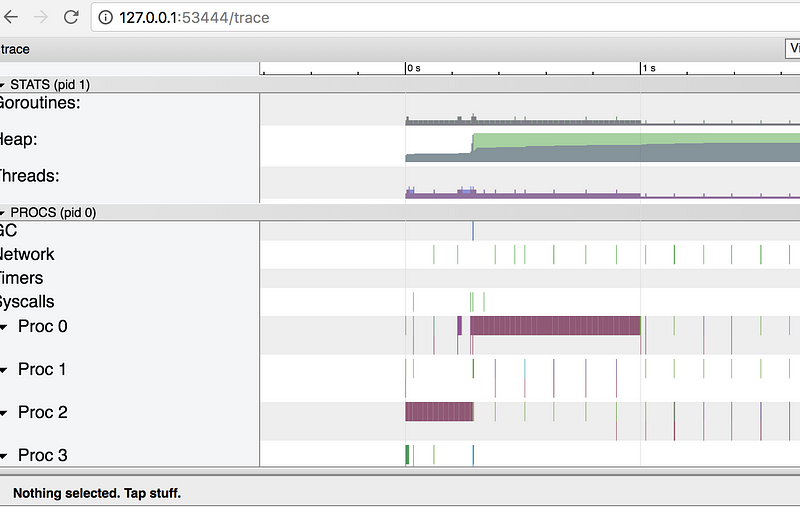
Too much!
Information overload! This is a fun UI, but honestly isn’t very helpful so far. I have a hunch that it’s networking related, so let’s click the Network blocking profile button above.
Full network blocking profile
In my actual app, this was way too much noise. My integration test was doing a large number of networking calls, when it was startup time I wanted to optimize.
Limit to a goroutine (improved in 1.10) Link to heading
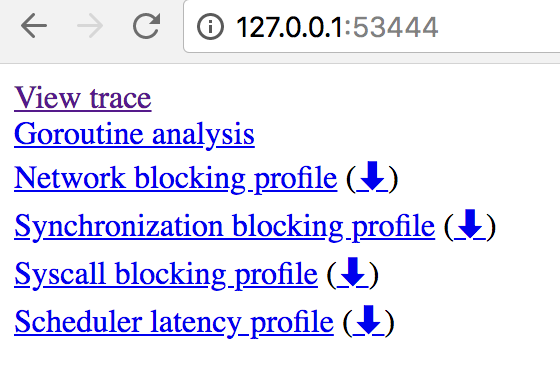
I know the specific goroutine that starts up my server. Let’s load just that for the trace by clicking the goroutines button.
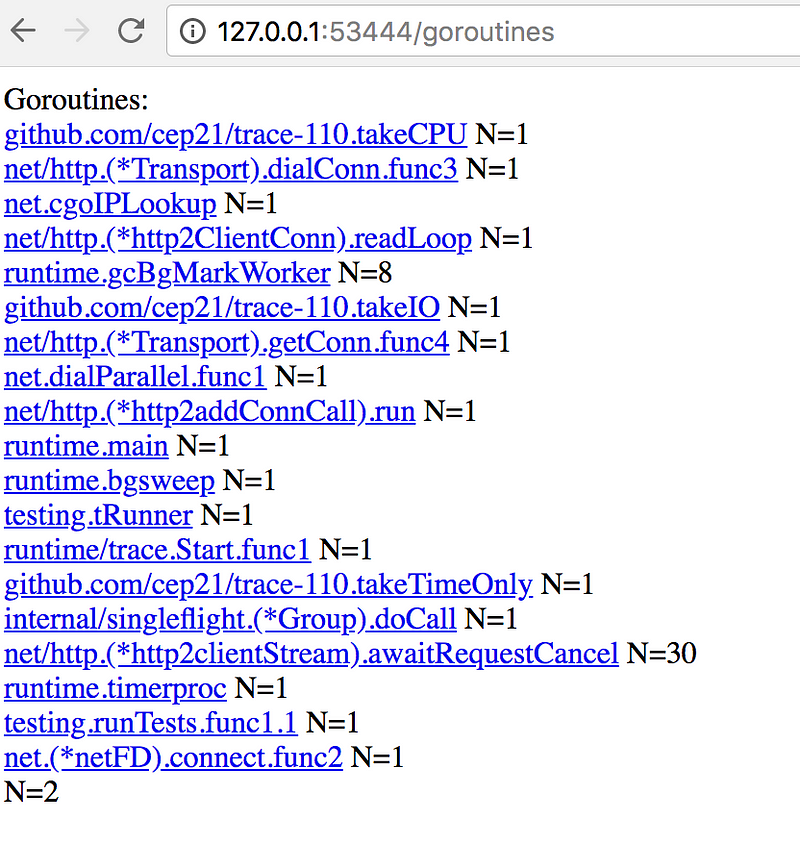
Goroutines in pprof
Notice they are clickable. I knew the name of my integration test goroutine, so I go there. It is the “takeIO” function for this example code.
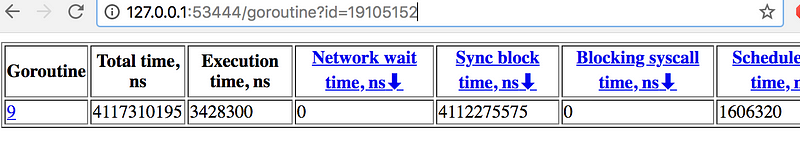
Small execution time, large total time
For this goroutine, the execution time is small because it does not do much. But the total time is large, since it’s waiting on IO most of the time.
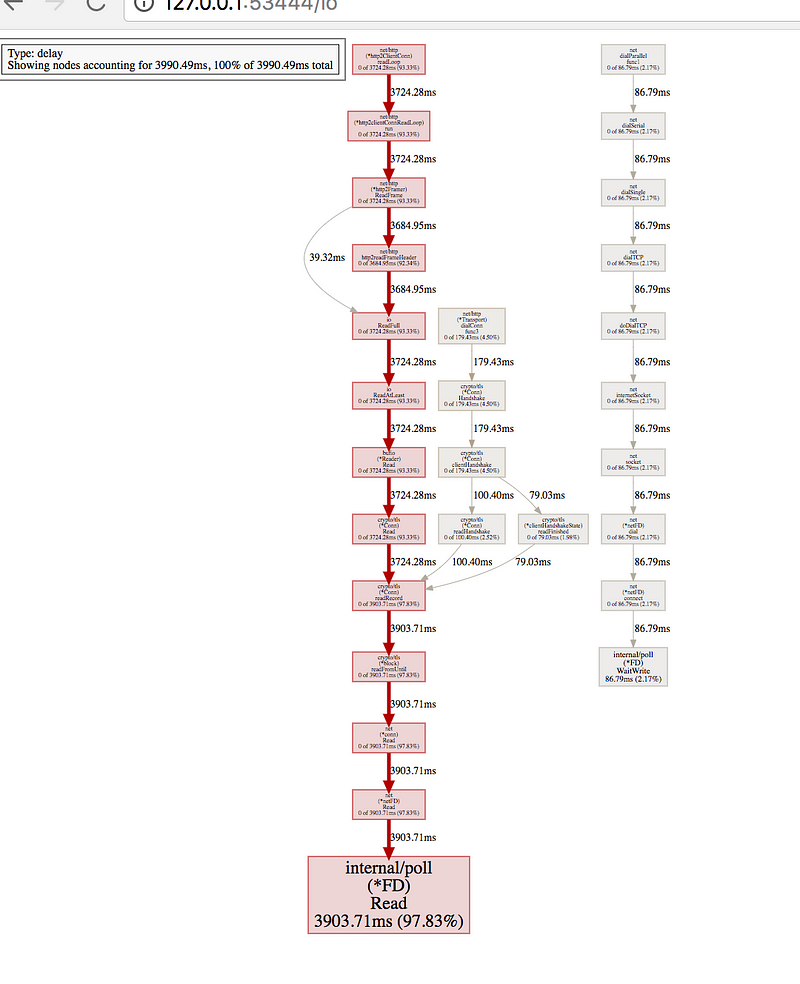
Large goroutine waittime
From here, I had all I needed to find the stack trace that was causing the slow startup time. This was enough for my use case, but I want more.

There’s an arrow!
Notice the blue down arrow on the goroutine page. I can click that to download a pprof usable profile. Rather than download it, I can reference it directly from the CLI.
> go1.10beta1 tool pprof 'http://127.0.0.1:53668/block?id=19105152&raw=1'
Fetching profile over HTTP from http://127.0.0.1:53668/block?id=19105152&raw=1
Saved profile in /Users/jlindamo/pprof/pprof.contentions.delay.005.pb.gz
Type: delay
Entering interactive mode (type "help" for commands, "o" for options)
(pprof) top
Showing nodes accounting for 4112.05ms, 100% of 4112.28ms total
Dropped 4 nodes (cum <= 20.56ms)
Showing top 10 nodes out of 13
      flat  flat%   sum%        cum   cum%
 4112.05ms   100%   100%  4112.05ms   100%  runtime.selectgo
         0     0%   100%  4112.28ms   100%  github.com/cep21/trace-110.takeIO
         0     0%   100%  4112.28ms   100%  net/http.(*Client).Do
         0     0%   100%  4112.28ms   100%  net/http.(*Client).Get
         0     0%   100%  4112.28ms   100%  net/http.(*Client).send
         0     0%   100%  4112.28ms   100%  net/http.(*Transport).RoundTrip
         0     0%   100%   380.97ms  9.26%  net/http.(*Transport).getConn
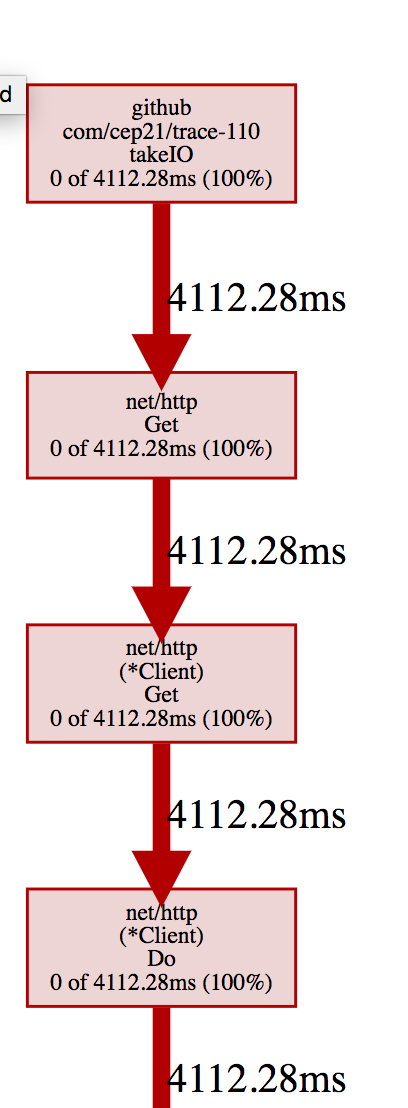
I can explore this just like normal pprof profiles. Top cumulative shows me the stacks that block the most for that goroutine.
I wanted to share this with coworkers, so I created a flamegraph. Flamegraphs are great ways to visualize complex stacks. Unfortunately, I need to use the original pprof for this.
go get github.com/google/pprof
I can now load up the profile using this pprof, not the one with Go. Notice no go tool at the front of the command.
> pprof -http "localhost:12345" 'http://127.0.0.1:53668/block?id=19105152&raw=1'
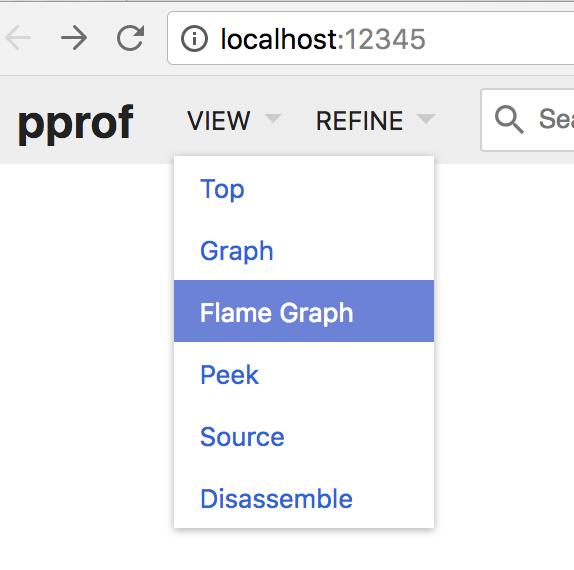
Click on flame graph
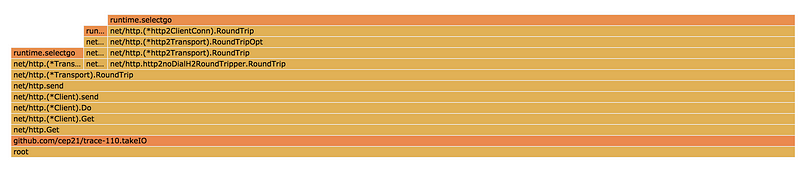
Flamegraph of the example
This flamegraph seems obvious for my toy example, but my real code’s stack trace was very complex and this was able to help tremendously.