Abstract Link to heading
We run a very large AWS EKS cluster with lots of interesting challenges. This post is about a recent investigation into DNS resolution failures that we were able to root cause to an Elastic Network Interface (ENI) packets per second (PPS) limit and a further root cause of the combination of sudo defaults and ndots in our cluster DNS.
This post talks about the investigation process and the resolution.
The Initial Bug Report Link to heading
The initial report came from a report of CI flakes. The flakes originated inside tensorstore and had an error of:
./tensorstore/util/result.h:420: Status not ok: status(): UNAVAILABLE:
CURL error Could not resolve hostname: Could not resolve host:
company-bucket.s3.amazonaws.com
The flakes happened across multiple instances and were not consistent. The curl source code for CURLE_COULDNT_RESOLVE_HOST was pretty generic, so I needed to dig deeper into the actual DNS resolution logs.
I went to the CoreDNS pod logs to see if there was a clue there:
kubectl logs -n kube-system deployment/coredns --tail=1000 | grep -i error
And found this error:
[ERROR] plugin/errors: 2 company-bucket.s3.amazonaws.com. A: read udp 10.1.2.3:44211->10.0.0.2:53: i/o timeout
The first IP address 10.1.2.3 is the CoreDNS pod trying to resolve a DNS request and the second IP address 10.0.0.2 is
the Route 53 resolver for the VPC. From the AWS docs here.
An Amazon VPC connects to a Route 53 Resolver at a VPC+2 IP address. This VPC+2 address connects to a Route 53 Resolver within an Availability Zone.
Another set of interesting logs I found were like this:
[ERROR] plugin/errors: 2 ip-10-8-1-3.us-east-2.compute.internal. AAAA: read udp 10.11.39.79:44211->10.10.0.2:53: i/o timeout
The majority of my failing lookups were for resolving internal hostnames. Also of interest were that these were AAAA (IPv6) queries when I usually only need IPv4 answers, so my traffic was growing 2x (resolving both).
AWS support case Link to heading
At this point, I pointed all the logs and information I had into claude and used it to help open an AWS support case with all the details AWS would need to help investigate. The AWS support UI is not very user friendly, and it can be difficult to aggregate all the information needed: if I don’t give the right information then AWS won’t have what they need to help diagnose the issue.
Claude Code is pretty good at this sort of thing and I have helper scripts that take as input:
- All the logs I’ve collected
- The bash history of the investigation
- The slack threads where we talked about the issue
Claude will ingest all this information, create a support case description, inspect it for privacy or privileged information, and then output a vim terminal with the support case description, priority, and service account details. From Vim, I can tweak context before saving and submitting the case to AWS.
I filed the case and AWS responded. One key insight from the support case was:
Regarding the DNS query limits, please observe that today there is a hard limit of 1024 packet per second (PPS) limit to services that use link-local addresses.
AWS gave me a command to run to check if we were hitting the link-local allowance limit:
ethtool -S eth0 | grep linklocal_allowance_exceeded
which did return a non-zero value on one of our affected nodes.
Packet limits Link to heading
Packet limits are documented here.
There is a 1024 packet per second (PPS) limit to services that use link-local addresses.
And the link local address is documented here.
Link-local addresses are well-known, non-routable IP addresses. Amazon EC2 uses addresses from the link-local address space to provide services that are accessible only from an EC2 instance.
It’s called link local because “they run on the underlying host”.
Putting it all together:
- CoreDNS is using UDP to resolve DNS queries
- These UDP packages are sent to the link-local address of the Route 53 resolver
- Due to the 1024 PPS limit, the packets are dropped
- As UDP is a connectionless protocol, the sender does not know that the packets were dropped and times out
Packet Exploration Link to heading
First, I started capturing the DNS traffic on a node running core-dns.
Next I sorted to find the largest offenders. I didn’t fully remember the parameters for tcpdump, so I asked
claude code to help craft the commands for me. I would review the commands, and if they looked reasonable, run them.
# Capture DNS traffic on the CoreDNS pod
tcpdump -i eth0 -w /var/tmp/dns-capture.pcap 'port 53'
Next, I sorted to find the largest offenders.
$ tcpdump -r dns-capture.pcap -nn dst port 53 -v 2>/dev/null | \
    grep -oE "A\? [^ ]+" | cut -d' ' -f2 | \
    sort | uniq -c | sort -rn | head -20
This was the result:
   1800 company-bucket.s3.us-east-2.amazonaws.com.
    586 company-bucket.s3.us-east-2.amazonaws.com.svc.cluster.local.
    573 company-bucket.s3.us-east-2.amazonaws.com.app-namespace.svc.cluster.local.
    548 company-bucket.s3.us-east-2.amazonaws.com.us-east-2.compute.internal.
    504 company-bucket.s3.us-east-2.amazonaws.com.cluster.local.
    # ... normal expected traffic ...
    # ... then the long tail of hostnames ...
     96 ip-10-0-1-10.us-east-2.compute.internal.us-east-2.compute.internal.
     96 ip-10-0-1-10.us-east-2.compute.internal.svc.cluster.local.
     96 ip-10-0-1-10.us-east-2.compute.internal.app-namespace.svc.cluster.local.
     96 ip-10-0-1-10.us-east-2.compute.internal.cluster.local.
     96 ip-10-0-1-10.us-east-2.compute.internal.
The first few lines were normal AWS or internal services that I expected. The traffic seemed fine, but there was a very long tail of hostname-like queries.
- Why was there so much hostname-like traffic?
- Why was each hostname-like query appearing 5 times?
Kuberentes DNS and ndots Link to heading
The hostname long tail traffic was the largest offender and due to the size of our cluster, it was a significant amount of traffic given a single hostname’s query would result in 5 queries to the VPC DNS resolver. (Note: Actually 10 queries since there were both A and AAAA records).
Inside an arbitrary pod’s container, I ran cat /etc/resolv.conf to see the resolve conf:
$ kubectl exec -it deployment/some-app -- cat /etc/resolv.conf
search app-namespace.svc.cluster.local svc.cluster.local cluster.local us-east-2.compute.internal
nameserver 172.20.0.10
options ndots:5
Breaking this apart:
search app-namespace.svc.cluster.local svc.cluster.local cluster.local us-east-2.compute.internal
These are the search domains that Kubernetes sets up for each pod. These allow your pod to resolve services either
in its own namespace or in the cluster. The last domain (us-east-2.compute.internal) comes from
the node.
nameserver 172.20.0.10
This is the cluster’s service CIDR (172.20.0.0/16) + 10, which is the default CoreDNS service IP. From the kubernetes docs:
As a soft convention, some Kubernetes installers assign the 10th IP address from the Service IP range to the DNS service.
The last section, options ndots:5, tells the resolver that any hostname with fewer than 5 dots should be treated as
non-fully-qualified and should have the search domains appended. My query amplification occurred because applications
weren’t using fully qualified domain names (FQDNs with a . at the end). Without this, the resolver would try each search domain from
/etc/resolv.conf in order, appending them to the hostname.
app-namespace.svc.cluster.localsvc.cluster.localcluster.localus-east-2.compute.internal
This makes a query for ip-10-0-1-10.us-east-2.compute.internal resolve to 5 queries (4 search domains + 1 as-is):
ip-10-0-1-10.us-east-2.compute.internal.app-namespace.svc.cluster.local❌ip-10-0-1-10.us-east-2.compute.internal.svc.cluster.local❌ip-10-0-1-10.us-east-2.compute.internal.cluster.local❌ip-10-0-1-10.us-east-2.compute.internal.us-east-2.compute.internal❌ip-10-0-1-10.us-east-2.compute.internal✅
Validating cache hits Link to heading
My initial tcpdump was for all port 53 traffic, but the link local traffic was only the non-cached hits. For those, I needed to filter for the source IP of the CoreDNS pod and the destination IP of the VPC DNS resolver.
# CoreDNS upstream queries to VPC DNS (10.10.0.2)
$ tcpdump -r dns-capture.pcap -nn \
    'src host 10.1.2.3 and dst host 10.10.0.2 and dst port 53' \
    -v 2>/dev/null | wc -l
This output was heavily dominated by the long tail of hostname-like queries, which were not cached by CoreDNS.
The source of the traffic Link to heading
I printed out a tcpdump capture and greped for some of the hostnames.
tcpdump -r /var/tmp/i-012a34e5678a32dcc.2025-08-01:02:47:53.pcap00 -nn -v 2>/dev/null | \
  grep "compute.internal" | head -10

02:47:53.589855 IP 10.1.0.1.51749 > 10.1.2.3.53:
  7274+ A? ip-10-1-0-1.us-east-2.compute.internal.us-east-2.compute.internal. (88)
02:47:53.589988 IP 10.1.2.3.54708 > 10.10.0.2.53:
  20127+ AAAA? ip-10-1-0-1.us-east-2.compute.internal.us-east-2.compute.internal. (88)
This is the two parts of a cache miss for DNS:
- The first query,
10.1.0.1.51749 > 10.1.2.3.53is some pod asking to resolve its own hostname:ip-10-1-0-1.us-east-2.compute.internal.us-east-2.compute.internal. - The second query
10.1.2.3.54708 > 10.10.0.2.53is CoreDNS asking the VPC DNS resolver to resolve that hostname because it wasn’t cached.
Finding the pod itself Link to heading
I had the host, but didn’t yet have the pod that was making the request. A major clue was in the pattern of queries I saw:
1. `ip-10-0-1-10.us-east-2.compute.internal.app-namespace.svc.cluster.local` ❌
2. `ip-10-0-1-10.us-east-2.compute.internal.svc.cluster.local` ❌
3. `ip-10-0-1-10.us-east-2.compute.internal.cluster.local` ❌
4. `ip-10-0-1-10.us-east-2.compute.internal.us-east-2.compute.internal` ❌
5. `ip-10-0-1-10.us-east-2.compute.internal` ✅
From this pattern, I can tell that the pod was in the app-namespace namespace. There’s also a clue that the pod itself
was using host networking since it was resolving an EC2 looking hostname.
# Filter at the kubectl level for the node
kubectl get pods -n app-namespace --field-selector spec.nodeName=ip-10-1-0-1.us-east-2.compute.internal -o json | \
jq -r '.items[] |
  select(.spec.hostNetwork == true) |
  .metadata.name + " " + .spec.nodeName'
Where in the pod? Link to heading
Now that I had a pod, I connected to the pod to verify that it was the source of the traffic.
# SSH into a node-service pod
kubectl exec -it -n app-namespace node-service-xxxxx -- bash

# Run tcpdump to capture DNS traffic
tcpdump -i any -nn port 53 -c 100
Every few seconds, we saw multiple DNS queries for the node’s own hostname:
10.11.240.139.54321 > 10.10.0.2.53: A? ip-10-11-240-139.us-east-2.compute.internal
10.11.240.139.54322 > 10.10.0.2.53: AAAA? ip-10-11-240-139.us-east-2.compute.internal
Unfortunately, the pod’s code was very complex and mostly written by someone else. There wasn’t a great way to time the outputs of the pod with the tcpdump output. Since the traffic had a pattern (many queries every few seconds), I deduced it was a continuous loop of some kind. I binary searched the code of the pod’s primary loop: early returning half the code to continuously narrow down where the exact traffic was coming from until I had a minimal change between two versions: one that included all the extra DNS calls and one that did not.
The code Link to heading
I narrowed it down finally to a few sudo calls
import subprocess
# ...
def some_function():
    cmd = f"sudo ..."
    result = subprocess.run(cmd, shell=True, capture_output=True)
    # ...
The pod itself was a system level administrative pod, so it makes sense that it would need to run commands with sudo,
but I didn’t understand why this specific command was generating so much DNS traffic. I ran the same ... command
myself on the pod and didn’t see any DNS traffic, however if I ran sudo ... then I did see DNS traffic. From this,
I knew it was sudo related. My first thought was something snuck into whatever subshell sudo was using.
I asked claude code what could be happening and it mentioned Defaults !fqdn, but I didn’t understand at the time
what that meant, so I instead asked claude to run the sudo ... command for me and figure out which system calls
were making the DNS requests.
I knew ltrace/strace were things I could use, but couldn’t fully remember the syntax. Claude code was helpful here:
able to create an ltrace command for me:
sudo ltrace -f -e 'getaddrinfo*+gethostby*+gethostname*' sudo ...
My thought going into the process was that the command itself (...) was creating the DNS queries somehow by doing something
different when ran with sudo, but the output was different and include:
[pid 964637] libsudo_util.so.0->gethostname("ip-10-13-7-193.us-east-2.compute"..., 65) = 0
[pid 964637] sudoers.so->getaddrinfo("ip-10-13-7-193.us-east-2.compute"..., nil, 0x7ffecf8ce6d0, 0x7ffecf8ce6c8) = 0
The sudoers.so->getaddrinfo line is clear evidence that sudo itself, and not the command it was running, was making
the DNS requests. From this, I went back to Claude’s original suggestion of Defaults !fqdn.
There are lots of threads on the web about people having issues with slow sudo due to this flag: here and here.
The fix Link to heading
Turning off this flag was pretty easy. I added this to our container image:
echo 'Defaults !fqdn' | sudo tee /etc/sudoers.d/00-no-fqdn
sudo chmod 440 /etc/sudoers.d/00-no-fqdn
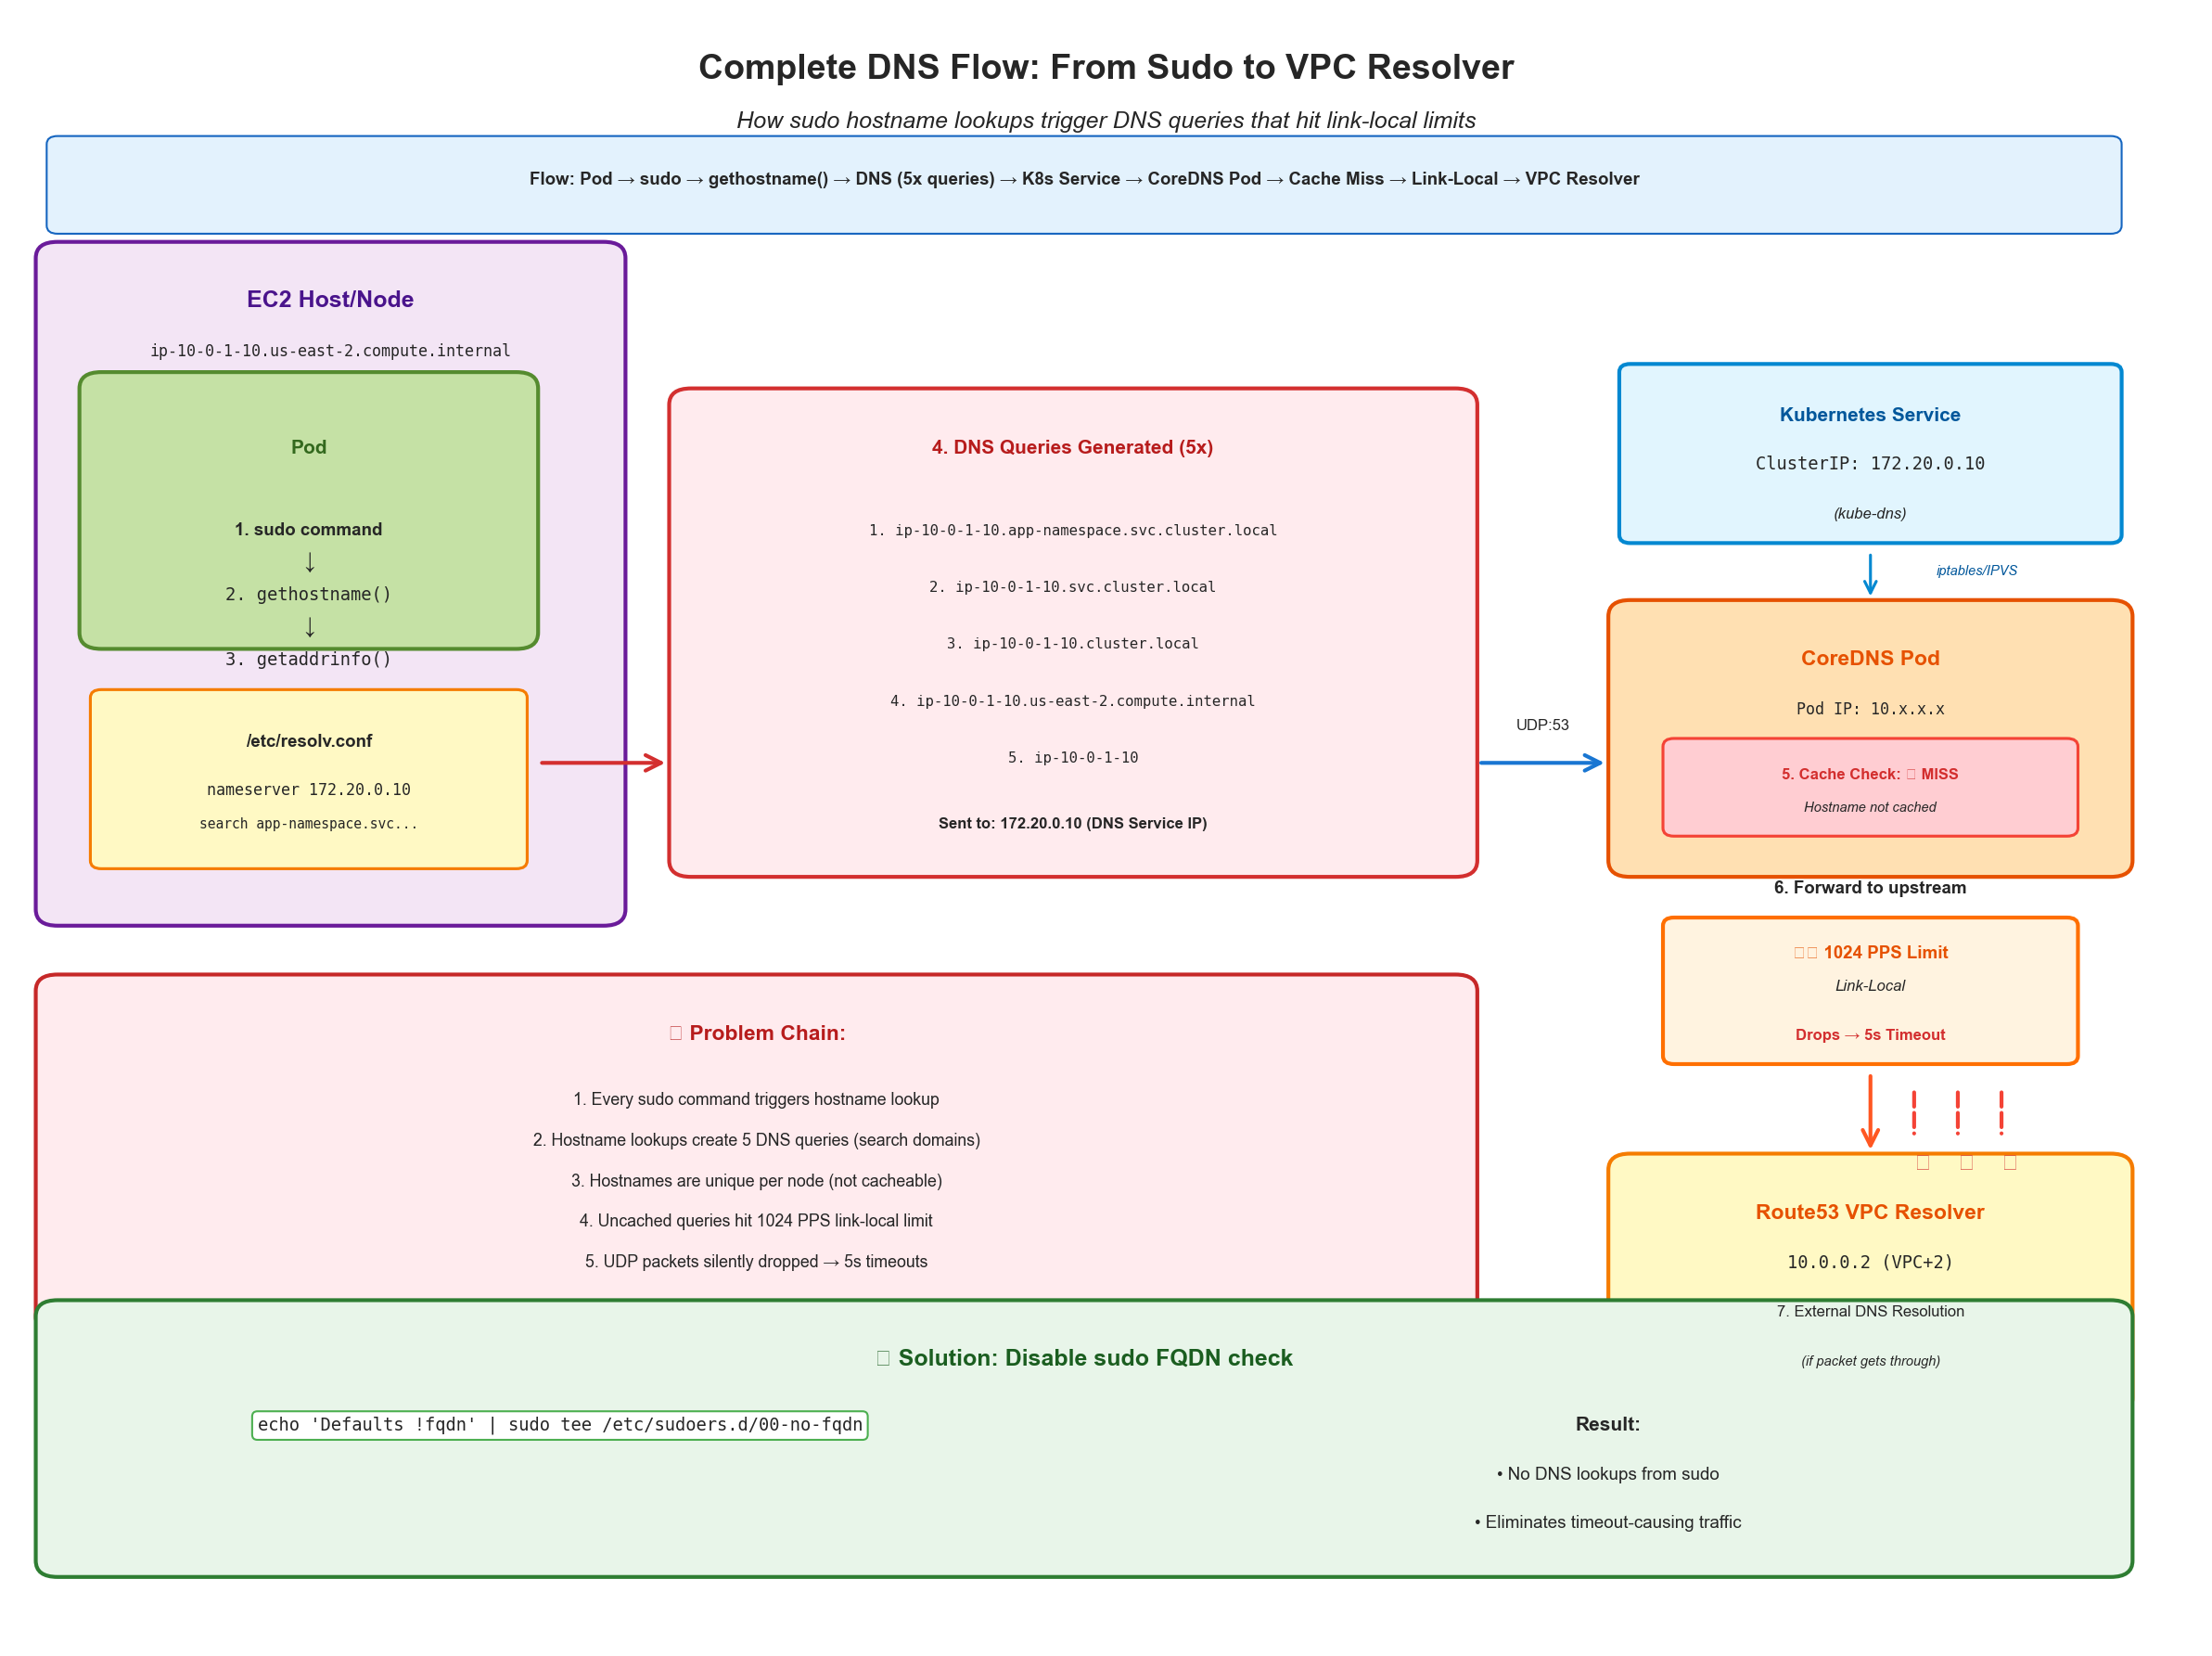
Complete DNS flow: How sudo triggers hostname lookups that cascade through Kubernetes DNS to hit link-local limits, and the solution
The result Link to heading
sudo commands no longer did hostname lookups and uncached DNS queries almost entirely disappeared after this change.
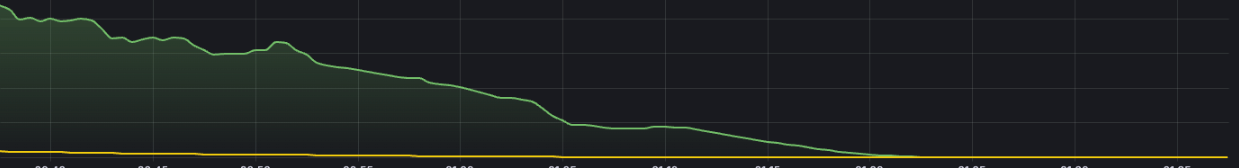
DNS traffic drop after fix - Green line shows uncached DNS queries to VPC resolver, Yellow line shows cached hits served by CoreDNS