I get woken up to an alert about read capacity on one of my DynamoDB tables. Here is the error being logged.
ProvisionedThroughputExceededException: The level of configured provisioned throughput for the table was exceeded. Consider increasing your provisioning level with the UpdateTable API.
When I load my CloudWatch graphs, and it appears I’m well below capacity.
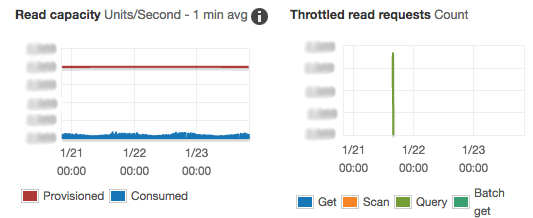
Cloudwatch graph of DynamoDB metrics.
These graphs show consumed capacity (blue on the left) well below provisioned capacity (red on the left), while our throttled requests spike for a bit then go down.
Our first thought is that DynamoDB is doing something wrong. Maybe it had an issue at that time. Before I go on, try to think and see if you can brainstorm what the issue was.
DynamoDB partitions items across a cluster. If you reserve capacity, you’re reserving capacity for the entire cluster assuming uniform distribution of reads. For example, if you want a capacity of 20,000 reads per second and the cluster happens to exist on 10 nodes, you could expect around 2,000 reads per second on a single node.
In our case, we had a single item that happened to be hot. This hot item caused a large amount of traffic on a single DynamoDB node which caused us to get throttled. This case was rare enough that we resolved it with a special case cache in situations with increased use.
AWS has a support ticket specifically about this issue. You can currently expect a maximum of 3,000 read units per partition. The lesson here is if you are throttled well below your reserved capacity, double-check your request distribution to ensure it’s uniform.