Go’s pprof package is frequently used for heap and CPU profiles, but a little used feature of the package is being able to create custom profiles. Custom profiles are useful for tracking down leaked resources and troublesome stack traces that are abusing a library’s API.
Profile Link to heading
From the godoc for pprof itself:
A Profile is a collection of stack traces showing the call sequences that led to instances of a particular event, such as allocation. Packages can create and maintain their own profiles; the most common use is for tracking resources that must be explicitly closed, such as files or network connections.
Another reasonable use of profiles is to track something that may not need to be explicitly closed, but is a function or resource that may block while called and you want to track current calls. Profiles are especially useful for things where a stack trace is useful and their main advantage is easy integration with go tool pprof.
Profile usage warnings Link to heading
The profile package panics with any usage error. Some of these panics are when:
- Creating a profile that already exists
- Associating a profile with the same item twice
- Removing a profile stack that hasn’t been added
- Removing a profile stack that has already been removed
Many of the ways to use the pprof package seem strange but try to work around these panics.
Creating the profile Link to heading
var libProfile *pprof.Profile
func init() {
    profName := “my_experiment_thing”
    libProfile = pprof.Lookup(profName)
    if libProfile == nil {
        libProfile = pprof.NewProfile(profName)
    }
}
Because profiles can’t be used with the same name twice, it makes sense to create them in init. You may be tempted to create one in a single line of code.
// Warning: /vendor panic possibilities
var panicProfile = pprof.NewProfile(“this_unique_name”)
The primary issue with using pprof like this is that the name passed may not be unique. Even if it is something you think is unique, if your library is vendored multiple times (which is possible) then your application will panic on startup. Since profiles are thread safe anyways, and init functions run one at a time, a lookup-then-create is the correct flow.
The godoc mentions the convention is to use a ‘import/path.’ prefix to create separate name spaces for each package,
but following this advice runs you into a known bug with cmd/pprof.
Instead, use your package name and path but with only characters [a-zA-Z0–9_].
Using the profile Link to heading
type someResource struct {
    *os.File
}

func MustResource() *someResource {
    f, err := os.Create(...)
    if err != nil {
        panic(err)
    }
    r := &someResource{f}
    libProfile.Add(r, 1)
    return r
}

func (r *someResource) Close() error {
    libProfile.Remove(r)
    return r.File.Close()
}
The primary functions are Add and Remove. In this example, I want to track any created resources that aren’t closed, so I add a stack trace when a resource is created and remove it when the resource is closed. Function Add requires a unique item each call, so I can use the resource as the key. Sometimes there is no good key to use for pprof.Profile, so you can create a useless byte and use its address as the key.
func usesAResource() {
       pprofKey := new(byte)
       libProfile.Add(pprofKey, 1)
       defer libProfile.Remove(pprofKey)
       // ....
}
Exposing the pprof Link to heading
If you import the http pprof library then Go will register http handlers for the profile package. This is normally done by adding an empty import in your main.go file.
import _ "net/http/pprof"
Another way to do this is to load the pprof handler manually for your own http handler.
httpMux.Handle("/debug/pprof/", http.HandlerFunc(pprof.Index))
Using the pprof Link to heading
I created an example application shown below and will use it to demo the profile.
package main

import (
    "fmt"
    "log"
    "net/http"
    _ "net/http/pprof"
    "os"
    "runtime/pprof"
    "sync/atomic"
    "time"
)

var libProfile *pprof.Profile

func init() {
    profName := "my_experiment_thing"
    libProfile = pprof.Lookup(profName)
    if libProfile == nil {
        libProfile = pprof.NewProfile(profName)
    }
}

type someResource struct {
    *os.File
}

var fileIndex = int64(0)

func MustResource() *someResource {
    f, err := os.Create(fmt.Sprintf("/tmp/%d.txt", atomic.AddInt64(&fileIndex, 1)))
    if err != nil {
        panic(err)
    }
    r := &someResource{f}
    libProfile.Add(r, 1)
    return r
}

func (r *someResource) Close() error {
    libProfile.Remove(r)
    return r.File.Close()
}

func trackAFunction() {
    tracked := new(byte)
    libProfile.Add(tracked, 1)
    defer libProfile.Remove(tracked)
    time.Sleep(time.Second)
}

func usesAResource() {
    res := MustResource()
    defer res.Close()
    for i := 0; i < 10; i++ {
        time.Sleep(time.Second)
    }
}

func main() {
    http.HandleFunc("/nonblock", func(rw http.ResponseWriter, req *http.Request) {
        go usesAResource()
    })
    http.HandleFunc("/functiontrack", func(rw http.ResponseWriter, req *http.Request) {
        trackAFunction()
    })
    http.HandleFunc("/block", func(rw http.ResponseWriter, req *http.Request) {
        usesAResource()
    })
    log.Println("Running!")
    log.Println(http.ListenAndServe("localhost:6060", nil))
}
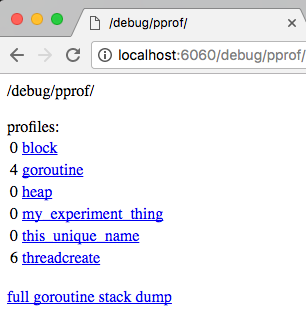
With this you can access http://localhost:6060/debug/pprof/ while your application is running locally and see all available profiles.
pprof HTTP endpoint
After adding some traffic to /nonblock and /block, click on the link for my_example_thing to see the profile sample.
my_experiment_thing profile: total 6
4 @ 0x2245 0x5d961
#   0x2244   main.usesAResource+0x64                 /Users/.../pproftest.go:64

2 @ 0x2245 0x2574 0x9c184 0x9d56f 0x9df7d 0x9aa07 0x5d961
#   0x2244   main.usesAResource+0x64                 /Users/.../pproftest.go:64
#   0x2573   main.main.func3+0x13                    /Users/.../pproftest.go:79
#   0x9c183   net/http.HandlerFunc.ServeHTTP+0x43    /usr/local/Cellar/go/1.7.1/libexec/src/net/http/server.go:1726
#   0x9d56e   net/http.(*ServeMux).ServeHTTP+0x7e    /usr/local/Cellar/go/1.7.1/libexec/src/net/http/server.go:2022
#   0x9df7c   net/http.serverHandler.ServeHTTP+0x7c  /usr/local/Cellar/go/1.7.1/libexec/src/net/http/server.go:2202
#   0x9aa06   net/http.(*conn).serve+0x4b6           /usr/local/Cellar/go/1.7.1/libexec/src/net/http/server.go:1579
Call graph pictures Link to heading
I used brew to install Graphviz on my mac since pprof needs an external application to generate a png.
brew install Graphviz
With graphviz installed, I can use pprof to generate a png call graph of stacks.
go tool pprof -png /tmp/mybinary ‘localhost:6060/debug/pprof/my_experiment_thing?debug=1’ > /tmp/exp.png
I used a PNG to attach to this blog post, but usually a SVG is easier to explore in your browser. Generate an svg, instead of a png, by passing -svg instead of -png to the pprof command.
The generated image is below.
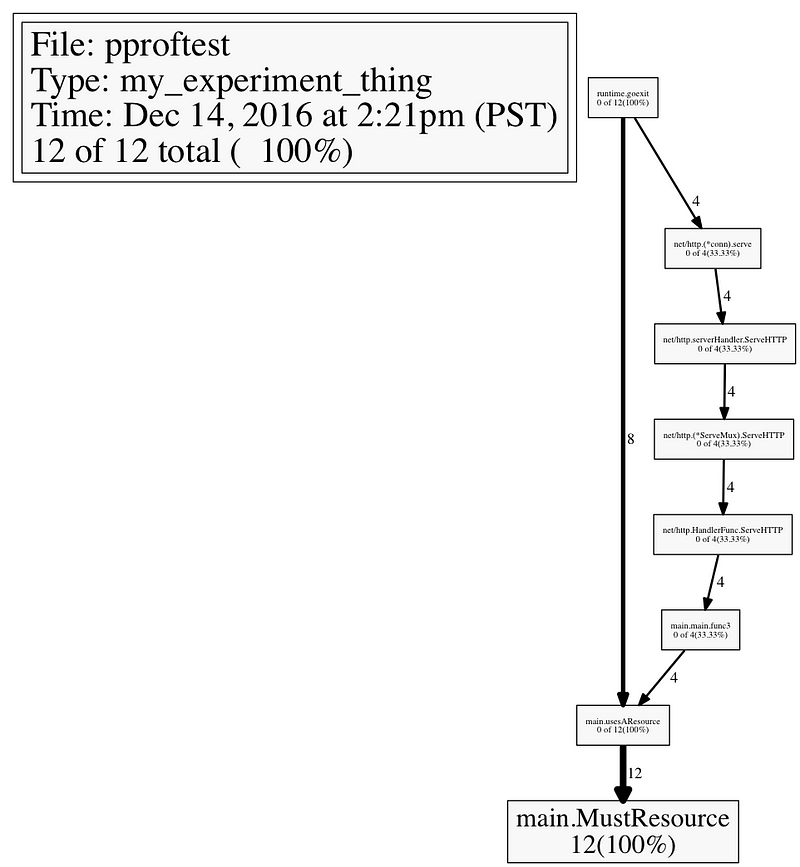
Pprof as graph
This image shows me the non closed stack traces of my resource. When generating this image, I sent twice as many non blocking requests as blocking requests and it shows in the stack trace. All call stacks end in MustResource. If this is redundant for your application, you can change the integer passed to Profile.Add when creating the profile.
You can also use the interactive console UI by running pprof in the terminal. Below, I’m running pprof and using the top command to see which function calls are more frequent in my stack traces.
> go tool pprof 'localhost:6060/debug/pprof/my_experiment_thing?debug=1'
Fetching profile from http://localhost:6060/debug/pprof/my_experiment_thing?debug=1
Saved profile in /Users/.../pprof/pprof.localhost:6060.my_experiment_thing.007.pb.gz
Entering interactive mode (type "help" for commands)
(pprof) top30
6 of 6 total (  100%)
      flat  flat%   sum%        cum   cum%
         6   100%   100%          6   100%  main.usesAResource
         0     0%   100%          2 33.33%  main.main.func3
         0     0%   100%          2 33.33%  net/http.(*ServeMux).ServeHTTP
         0     0%   100%          2 33.33%  net/http.(*conn).serve
         0     0%   100%          2 33.33%  net/http.HandlerFunc.ServeHTTP
         0     0%   100%          2 33.33%  net/http.serverHandler.ServeHTTP
         0     0%   100%          6   100%  runtime.goexit
(pprof)
Create your own Link to heading
The exposed API of Go’s pprof Profiles limit some of the functionality that’s exposed for CPU and memory dump call graphs, but they’re still a pretty neat visualization for little effort. The next time you write a library, and stack traces are useful debugging information, see if they fit in.